Rewards Program Dashboard: Showing sales reps what they’ve earned and how far they are from their next goal.
Sales reps had to check several places and do the math themselves to see how close they were to a goal. After the Anixter acquisition, I led the redesign of a shared dashboard that put progress, supplier rewards, and program updates in one place.
Project Overview
- Role
- UX Manager · Lead Designer
- Timeline
- 1 month
- Focus
- I led the dashboard’s information hierarchy and interaction design, working with teams to align goal tracking, incentive rules, and terminology across both programs.
- Deliverables
- UX audit of both dashboards, user flows, wireframes, high-fidelity designs, progress and milestone components, and a measurement plan.
The Challenge
The legacy dashboards used different layouts, terminology, and incentive structures. Unifying them meant agreeing on how to represent performance while preserving the information sales reps needed in their daily work.
Progress was spread across the page
Sales reps had to piece together how they were doing.
- Goal status required scanning multiple sections
- Dense tables obscured supplier performance and comparisons
- Reps had to cross-reference data and calculate remaining goals
The dashboard needed to show current achievement, what remained, and which incentives were available.
Bring goals and incentives into focus
Use a shared structure with visible progress.
- Put goal status and remaining progress together
- Show milestones and completion states visually
- Group supplier goals, bonuses, and earned points
- Use consistent labels and patterns across programs
Program updates and support resources stayed within the same dashboard.
Explore the Interactive Prototype
Explore the dashboard’s goal tracking, supplier incentives, and program information.
Design Strategy: Making Progress Easier to Read
The legacy dashboards had no behavioral analytics. I used the UX audit and input from the teams responsible for the programs to guide the redesign.
We reviewed how sales reps tracked progress and worked through the rules behind each program’s goals and rewards.
That work informed three design decisions:
Lead with goal status
Give the scorecard a clear hierarchy so current achievement and completion status have a consistent place.
Show the next milestone
Use progress indicators and tier states to show the relationship between current performance and the next goal.
Connect rewards to achievement
Use visual rewards to acknowledge milestones while keeping goals and incentive details central to the experience.
The scorecard brings completion status, milestone tiers, and total achievement into one view.
Each supplier view pairs progress indicators with purchase goals, bonus multipliers, and earned points.
Updates, resources, and support links sit alongside performance information.
Aligning Two Programs Across Teams
For one dashboard to work for both programs, we had to agree on what counted toward a goal and how each reward tier worked. I worked through those decisions with leadership, Product, Engineering, Sales, and Analytics.
Together, we aligned:
- Goal structures and tier definitions
- Incentive logic and bonus calculations
- Data mappings across reporting systems
- Shared terminology across both programs
My role was to turn those shared definitions into consistent scorecards, supplier views, and progress components.
- Sales reviewed how reps tracked performance in their daily work.
- Product aligned priorities with the integration timeline.
- Engineering brought the legacy program logic into the shared platform.
- Analytics defined the measurement framework.
Impact and Outcomes
The redesign replaced two disconnected dashboards with one shared experience for the sales organization.
- Standardized how goals, tiers, and incentive information appeared
- Brought progress and achievement into a unified scorecard
- Paired supplier performance with relevant reward details
- Kept program updates and support resources within the dashboard
Analytics tracking was added to the new platform to support future evaluation of dashboard engagement and incentive activity.
Reflection
A shared dashboard starts with a shared understanding of the program.
Agreeing on goals, tier definitions, and terminology was as important as the visual design. Those decisions gave the dashboard a consistent structure across both programs.
With limited behavioral data, workflow reviews and stakeholder input helped ground the design. In future work, I would define the measurement plan early so the team can evaluate the experience after launch.
Read more of my case studies
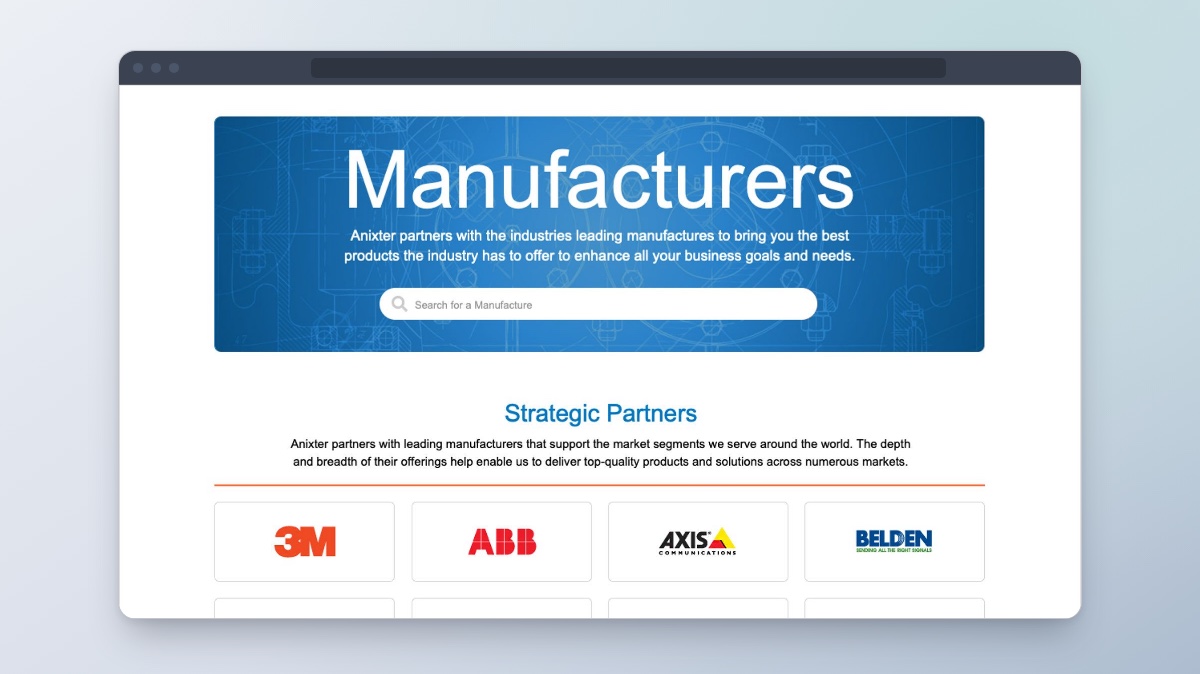
Manufacturers Directory
Helping customers find manufacturers, see what they offer, and explore their products.
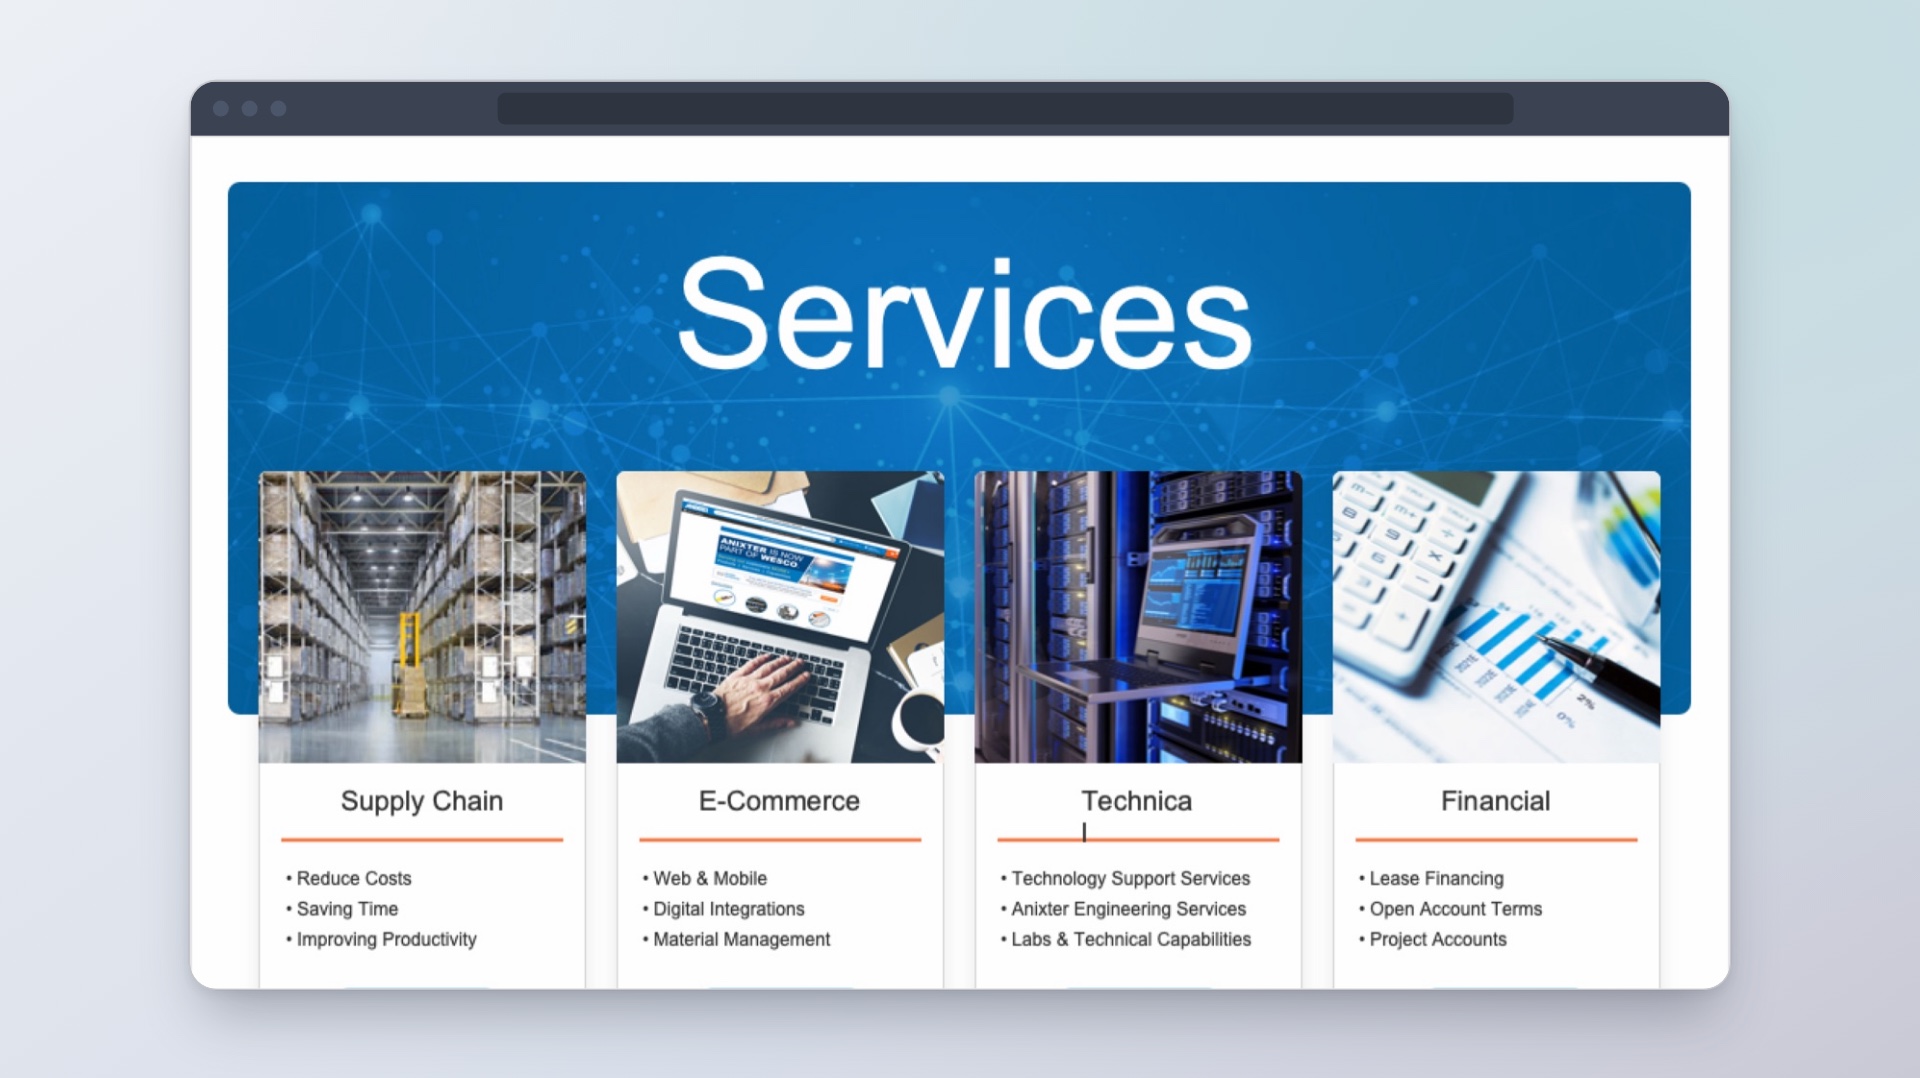
Services & Solutions
Helping customers find the right service and see what to do next.
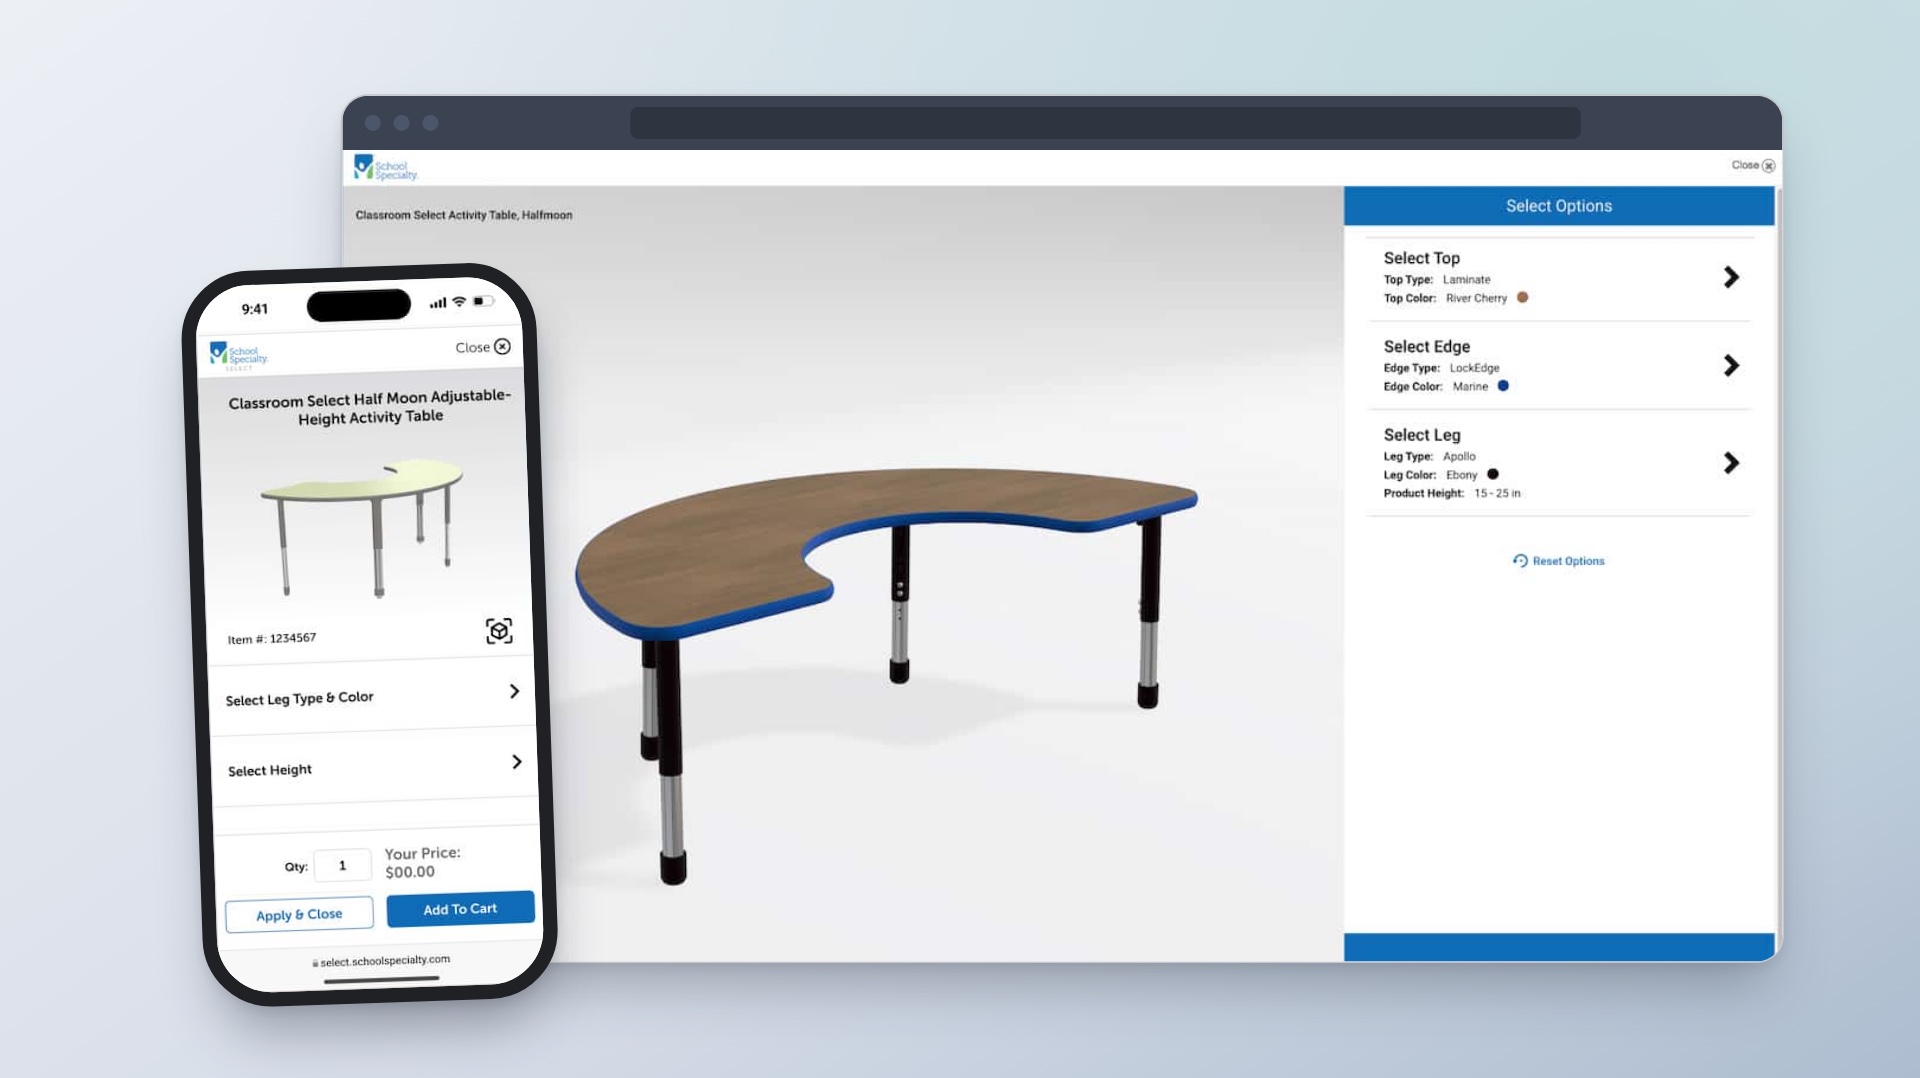
Enterprise Product Configuration Platform
Helping customers choose classroom furniture and see how each option changes the design and price.